
Trading strategies and technical indicators are among the basic trading tools. It’s impossible to trade without an accurate strategy, while the strategy can’t be built without applying technical indicators. Although the concepts are related, should we compare them? Keep reading to find out the difference between these concepts.
Definition
Here are the definitions of both concepts:
- A trading strategy is a set of rules based on technical tools (indicators, lines, etc.) and fundamental factors to enable the forecasting of price movements.
- A technical indicator is a tool based on mathematical calculation. It measures the historical price data to provide signals on the upcoming price direction and its intensity.
So, the technical indicator is a tool used to build a trading strategy. Thus, these terms can’t be compared.
It was discovered that technical analysis rules could be used when trading NASDAQ Composite and Russell 2000 indices. However, such rules don’t exist for DJIA and S&P 500. Rules of technical analysis may even improve unprofitable trades. Still, a trader should remember that there are no rules or approaches that would guarantee 100% profitability.
Goal
A trading strategy is used to increase the chance of a successful trade and limit the time a trader must spend on one trade.
Technical indicators provide signals on the upcoming price movements as well as their intensity.
Creation
A trading strategy is built on a set of conditions. The conditions are formed by fundamental factors and/or technical indicators. The technical indicator is the most common tool for creating a trading strategy, as it allows the trader to define accurate points for opening and closing a trade. Fundamental analysis can also be used to determine market conditions. However, it doesn’t allow the trader to set exact levels.
The calculation of a technical indicator is based on a mathematical formula that mostly considers historical price data.

Basic terms
Let’s consider the key terms that are used for any trading strategy and technical indicator.
Trading strategy
The trading strategy includes trade filters and trade triggers.
- A trade filter is a condition that may trigger a trade.
- A trade trigger is a certain condition that tells a trader to open a position. As both terms are interconnected, let’s consider an example.
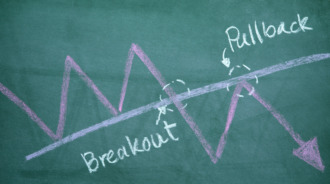
Imagine you use a breakout trading strategy based on the head-and-shoulders chart pattern. A trade filter is an event when the price breaks below the neckline of the pattern. This tells a trader to be ready to open a short position. However, this can be a fakeout. So, the trader needs a confirmation that will trigger the trade opening. This confirmation can occur when the price closes below the neckline.
Every effective strategy must include entry and exit points.
- Entry point. An entry point is the level at which a trader opens a position. It’s a single point that allows traders to enter the market at the early stages of trend formation.
- Exit point. An exit point is the level at which a trader closes a position. It’s presented by two points as there is no guarantee the open trade will be successful. These are take-profit and stop-loss orders.
- A take-profit is a level at which the trade is closed with returns.
- A stop-loss is a level at which the trade is closed with a loss.
Traders shouldn’t enter the market if they don’t set both levels. Otherwise, they increase their chance of loss incredibly.
Using trading strategies
When you are using trading strategies, you must know how to incorporate your technical indicators. That being said, the technical indicators you use will depend loosely on the strategy type you plan on building. When you create a trading strategy, think about your style and your risk tolerance.
If you want to go for large profits and long-term movement, you may want to use trend-following strategies. Indicators that follow trends such as a moving average can help you in this case. On the other hand, if you want a strategy with small yet frequent gains, you may go for volatility indicators. These are often better for short-term investments, making such a strategy appropriate for day traders.
Technical indicators
Traders have numerous technical indicators to study, many of which are in the public domain. This can include proprietary indicators that are commercially available, the stochastic oscillator, the moving average, and many more.
A professional trader can also develop their technical indicator. They will need a good programmer that knows how to introduce key inputs. Technical indicators analyze previous days of price activity to suit the needs of a trader (i.e., a 60-day price movement).
Technical indicators
There are five major types of technical tools:
- Trend indicators. This category consists of indicators used to analyze the price trend (bullish, bearish, horizontal) within a certain period.
- Momentum indicator. This type includes indicators that measure the speed of a price movement over a certain period.
- Relative strength indicators. These indicators measure market fluctuations in buying and selling pressure.
- Mean reversion indicators. These tools help evaluate the size of a price swing before the price retraces.
- Volume indicators. These indicators aim to define the strength of buyers and sellers on the market by calculating trades.
There is another classification. Indicators can be leading and lagging.
- A lagging indicator provides delayed signals and confirms the formed trend.
- A leading indicator provides signals on the upcoming price movement and allows traders to enter the market at the beginning of the trend.
Using technical indicators
Traders use technical indicators to determine the current condition of the market. It is not a strategy per se, but the resulting data may be used to create one. That being said, depending on the trading strategy that you have in mind, you may want to use different technical indicators.
When you use multiple technical indicators of the same kind, you will receive the same type of information from three different sources. The process is referred to as multicollinearity, and it should be avoided as much as possible. This is because results are often redundant and can produce an inaccurate signal.
Examples
As it’s already known, technical indicators provide signals on price directions. These signals are basic, and they are written in a certain way. For example, when the RSI indicator breaks above the 20 level, it’s a signal to open a long trade. However, this is only an application of a technical indicator that can’t be called a strategy.
The trading strategy should include accurate information. Let’s transform the rule above into the trading strategy:
- The RSI indicator with the period of 14 should be applied to the H4 timeframe.
- The price should move within a strong downtrend.
- The RSI line should break above the 20 level. As the RSI is a leading indicator, there should be a confirmation. Look for a reversal candlestick pattern. Set a take-profit order at recent highs.
- A stop-loss order should be placed several points below recent lows (the number of points depends on the volatility level and the size of the trade).
Takeaway
“Trading strategy” and “technical indicator” are interconnected terms. However, they can’t be compared. A strategy is built on a technical indicator, while the indicator provides signals on the price direction to set accurate entry and exit points. To trade successfully, a trader should start with learning a technical analysis which includes candlestick and chart patterns as well as indicators. Traders will be able to use trading strategies or even develop their own only after they learn effective indicators.


