
Bjorgum key level is a technical indicator that spotlights vital market levels on the price chart. Key levels aim at making trading more effective. Eight of every ten traders use critical levels and zones when analyzing the price chart. This is because crucial levels inform a trader of the extent to which other traders buy or sell at a particular level.
More so, technical traders leverage Bjorgum key levels to identify the probability of buying or selling on the price chart. This guide is crafted to help you understand how Bjorgum key level works and how to trade using key levels. Firstly, let’s walk you through how key levels work.
Earn profit in 1 minute
How Bjorgum key level work
The Bjorgum key level helps traders identify different levels based on patterns formed by price actions on the chart. These levels include Breakouts, False breakouts, and Price retest. Each time any of the stated phenomena occurs on the price chart, the Bjorgum critical level indicator rules out a level on the price chart. This level may be helpful to traders in futures trading.
Let us explain each phenomenon in detail:
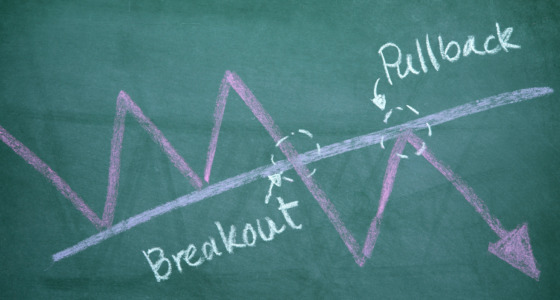
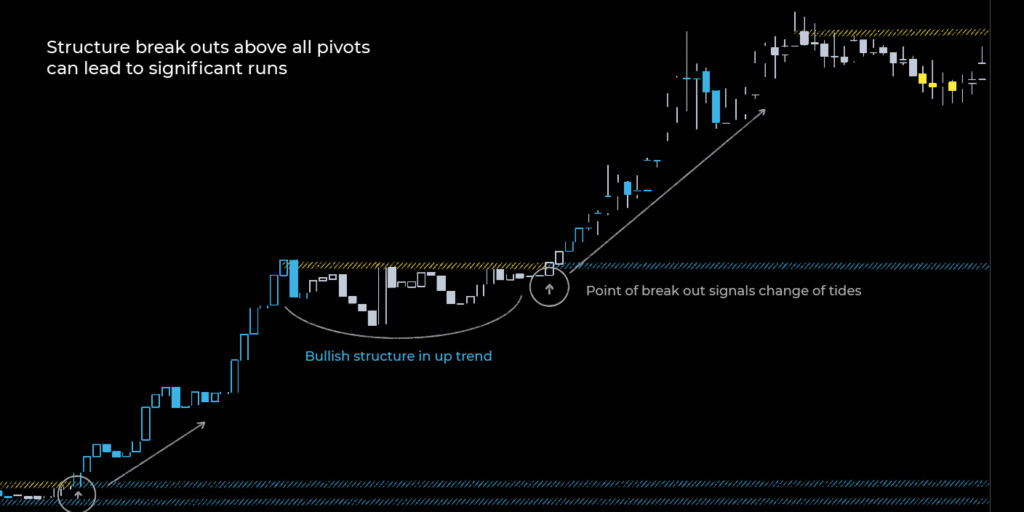
Breakout
Price breakout levels can bring about a noticeable price rally when the market turns to one side after a breach of key levels. This type of entry can result in massive price trend runs on the chart. Breakout levels also help to maintain symmetry in the structure of prices. This allows the use of technical analysis to be feasible.
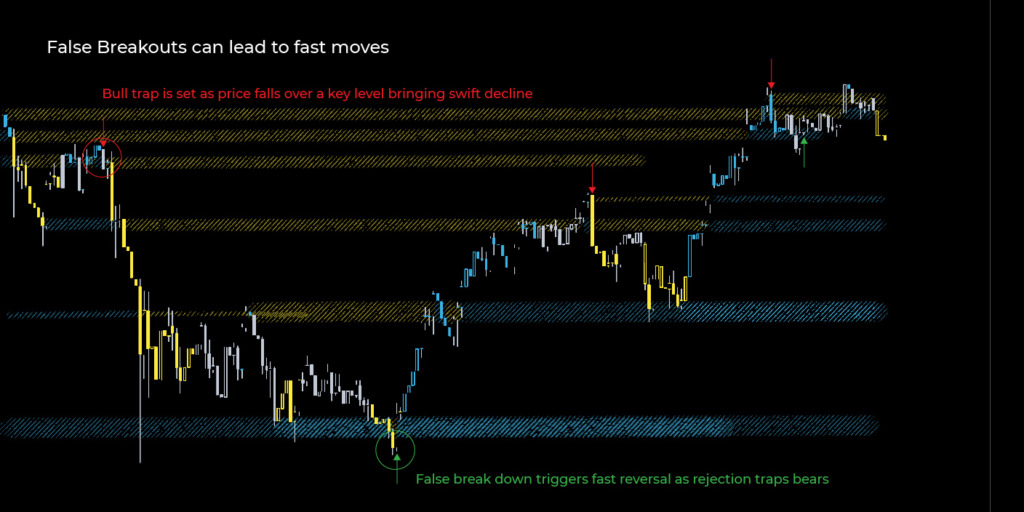
False price breakout

False breakouts—often referred to as bull or bear traps, are an excellent way to draw out critical levels on the price chart. This is because they represent diverse trading activities from a specific key level. False breakouts can result in a quick and significant reversal in price trends towards the opposite direction. Whenever there is a failure in the price breakout from a key level, traders who open positions to leverage the false breakout will be left hanging and forced to exit at their loss.
This indicator often draws a horizontal rectangle where the false breakout of a key support or resistance level occurs. This point on the price chart will eventually become a key level for a price trend reversal in the future.
Price retest or back checks
As prices maintain a staggering trend, there is usually a retest to check the significance of specific support and resistance levels. This retest occurs as a price bounce. The below chart gives more insight into how retests affect the position of key levels on the price chart.
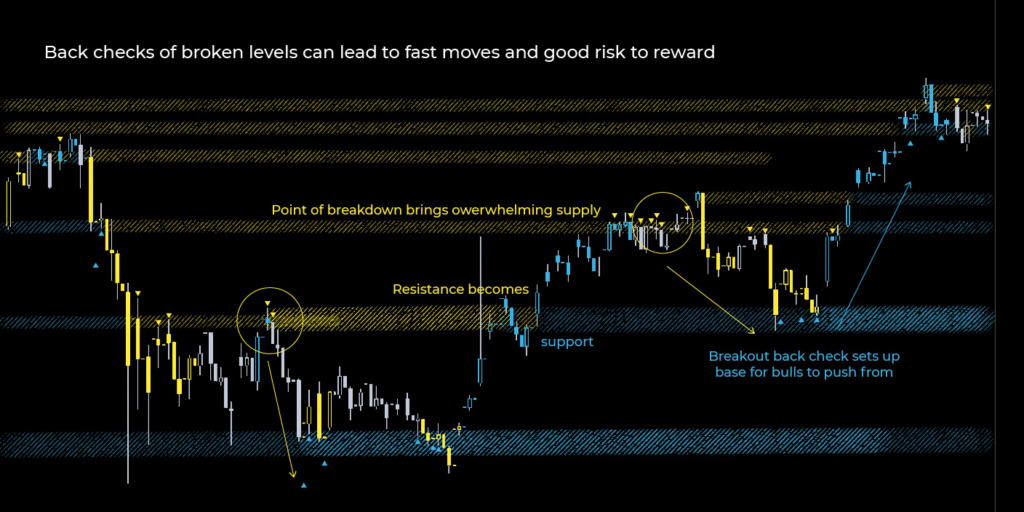
As a rule, when trading with technical indicators, it is considered that whenever there is a breakout in the support zone, that zone instantly becomes a resistance zone. Likewise, when there is a breakout in a resistance zone, that zone immediately becomes a support zone. So overall, price retest or back checks come in handy when trailing trends in your trading.
Effective strategies in your mailbox
Subscribe and discover a fund of trading knowledge
Great! Please check your email
We’ve sent you an email to confirm your subscription
Something went wrong
Try reloading the page. If that doesn’t help, please try again later
How can I trade with Bjorgum’s vital levels?
As we have explained above, the Bjorgum level is an indicator based on price patterns formed by price breakouts, false breakouts, and price retests. Therefore, you can trade with Bjorgum key levels using these three methods. First, however, below are some of the steps that you can adopt when dealing with key levels:
- Always waiting patiently for one or more key levels to be formed on the price chart. Increasing the timeframe on your chart will help you to visualize certain key levels quickly.
- Note the direction of the price trend, then position it with the visible key zones.
- Be on the lookout for patterns of candlestick formation at the zone. This could be a bear or bull pattern. For the sell zone, be patient until a bearish (downward) candlestick pattern is formed. For a buy zone, on the other hand, look out for the formation of a bullish (upward) candlestick pattern.
Trader’s level test
Answer 7 short questions and define your level as a trader. Take the test now to evaluate your real knowledge!
Start test

Finally…
Bjorgum key level is an important technical indicator that gives you insight on when to buy or sell. Mastering this indicator along with other technical indicators such as the MACD, RSI, Bollinger bands, e.t.c will improve the efficiency of your trading.
If you’re having a hard time identifying false breakouts on your own, the Bjorgum key level indicator will help you out with that. Therefore, always keep them on when analyzing your price chart.
Trading with up to 90% profit
<span>Like</span>